Solution 12093: Displaying Asymptotes on the TI-89 Family, TI-92 Plus, and Voyage™ 200 Graphing Calculators.
How can asymptotes be displayed on the TI-89 family, TI-92 Plus or Voyage 200?
The TI-89 family, TI-92 Plus, or Voyage 200 units do not display asymptotes. The graph application plots a series of points, separated by the number of pixels specified in the "xres" variable on the window screen. As successive points are drawn, they are joined by a line. If two successive points lie on either side of a discontinuity, they will be joined by a line, which may look like a vertical asymptote in some cases (but is simply an artifact of the graphing process).For example, y=(x-2)/(x+3) graphed in the window xMin= -9 and xMax=6.8 will not display the connecting line or "asymptote".
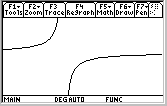 In this example, the x range is chosen so that one of the "plotted" points corresponds exactly to x = -3 (which happens to be a simple pole)- One may see this via the trace [F3] feature on the graph screen.
Since the function is undefined there, the point is not plotted, and the points immediately to the right and left are not joined by a line. Changing the xMin or xMax values by a small amount will shift the x values that correspond to the plotted points, so that no point will correspond to x = -3 and therefore the "asymptote" will appear.
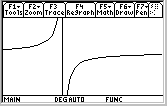 The window is 160 pixels wide. The graph appears to display only 159- the rightmost pixel is not used. Thus, in the example above, the specified xmin and xmax window settings placed each plotted point exactly 0.2 units apart, starting at x = -9.0, assuming xres was set to its default value of 2. The distance on the x-axis between successive pixels is stored in the system variable Dx. Choosing different xmin or xmax values will change the value of Dx, and therefore it is less likely that one of the plotted points will fall exactly on x = -3, regardless of the xres setting.
 Thus, one can choose the window so that asymptotes do not appear for some (but not all) functions with odd-order poles, but this is almost certainly a waste of effort (even in cases where this is possible, the resulting graph may not show the interesting behavior of the function, for example).
Please see the TI-89 family, TI-92 family and Voyage 200 guidebooks for additional information.